Options Open Interest by Strike: Where Bitcoin's Big Bets Sit
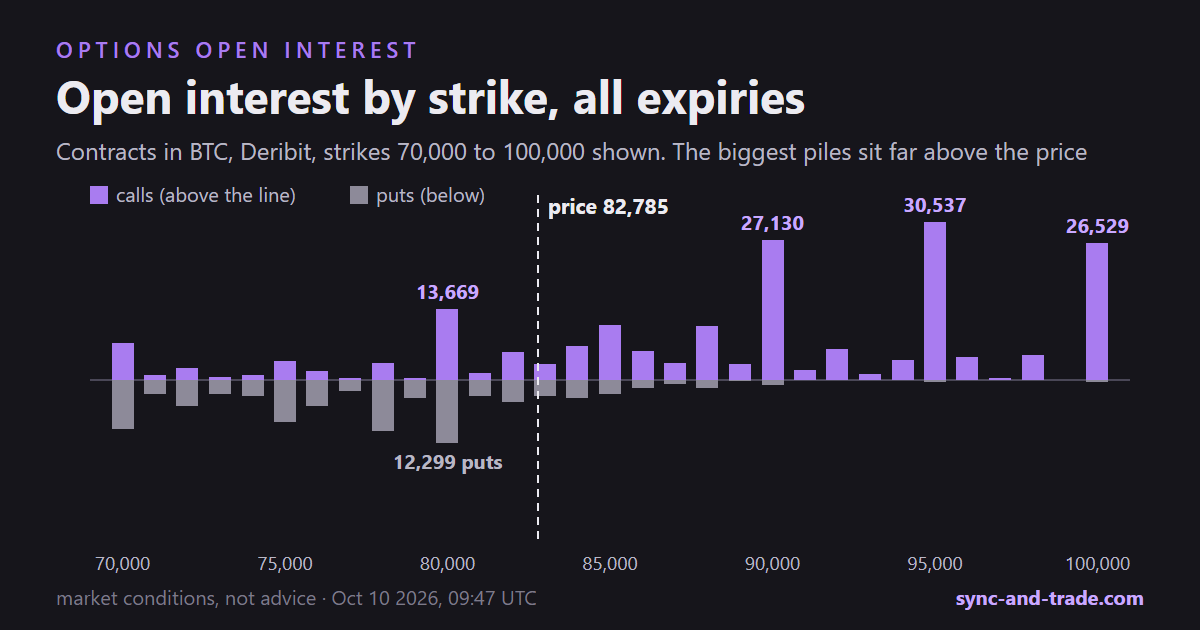
Ask where the big Bitcoin options sit and most people point at the price. Look at the open interest chart and the biggest piles are nowhere near it. On October 10, 2026, with BTC at 82,785, the three biggest strikes are 95,000, 90,000 and 100,000, all well above. Calls and puts together, they hold about one contract in five. Here is the picture, and what to make of it.
What open interest is
Open interest, or OI, is the number of option contracts that have been opened and not yet closed or expired. On Deribit one contract is one bitcoin. Count it by strike and you get a map of where positions exist.
It is different from volume. Volume counts trades during a period; OI counts what is still standing at the end of it. A strike can have loud volume and little OI if everyone closed their trades by evening.
Reading the chart
Purple bars above the line are calls, grey bars below are puts, summed over all expiries. The chart shows strikes from 70,000 to 100,000; there are bigger numbers further out that do not fit in the frame.
- 95,000 has 30,537 calls, the biggest pile on the chart. 90,000 has 27,130 and 100,000 has 26,529. With their puts, these three hold about 86,000 contracts, roughly 20% of all open interest.
- Puts are rarer. Across all strikes there are about 0.64 puts for every call. The put side is thicker below the price, at 70,000 to 78,000.
- Several strikes are big on both sides. 80,000 has 13,669 calls and 12,299 puts, 82,000 has 5,382 and 4,330, 70,000 has 7,135 calls and 9,397 puts. At 83,000, right next to the price, calls and puts are about even, near 3,000 each.
A strike where calls and puts are both big is not a mistake. It can be a place where hedgers and speculators meet, or where trades from different months overlap. The table cannot say which.
The twist: the biggest pile is not the biggest force
If open interest were everything, 95,000 would be the most important level on the map. It is not. Our gamma map weighs contracts by how close price is and how much time is left. Today 95,000 has about 31,000 contracts but only 33 million dollars of gamma per 1% move. The 80,000 strike has fewer contracts, about 26,000, and about 70 million of gamma, because price is much closer to it.
So OI answers "where are positions?" and gamma answers "where would dealers' hedging weigh on price?" They are different questions. For the second one distance and expiry matter a lot: in our archive of 11 days, whether price touched a big strike before expiry depended on distance in ordinary moves, and strike size added nothing beyond it. That window is short, we will repeat the test in November, and for the whole map the "no" is not proven.
What open interest does not tell you
- Who is long and who is short. Every contract has a buyer and a seller. A pile of calls is not a "call wall" that stops price by itself.
- Direction. A big call strike does not mean people expect price to go there. Many sellers of those calls are happiest when price stays below. Whether big piles pull price at all, we and the data are still arguing about.
- Whether it will still be there next week. 36.7% of all contracts expire on October 30 and 32.2% on December 25. A strike's OI can drop sharply after one expiry.
These are conditions of the market, not a signal.
Quick answers
What is options open interest?
The number of option contracts still open, counted after the day's trades. On Deribit, one contract is one BTC.
What does a big open interest strike mean?
That many positions exist there. It does not say who benefits or where price will go.
Is high open interest the same as high volume?
No. Volume counts trades in a period; open interest counts positions still outstanding.
Where can I see this live?
The levels map shows each strike weighted by distance and time, and the course explains how to read it.
Market conditions, not investment advice. Deribit data, snapshot October 10, 2026, 09:47 UTC.