Bitcoin Options Explained: How to Read the Deribit Option Chain
Open the Deribit options page for the first time and you get a wall of numbers: twelve expiry dates, dozens of strikes, columns that look like a spreadsheet nobody finished. Most people close the tab. Don't. The wall reads left to right in about a minute, and once you can read it, you can see what the market is charging for a week of uncertainty.
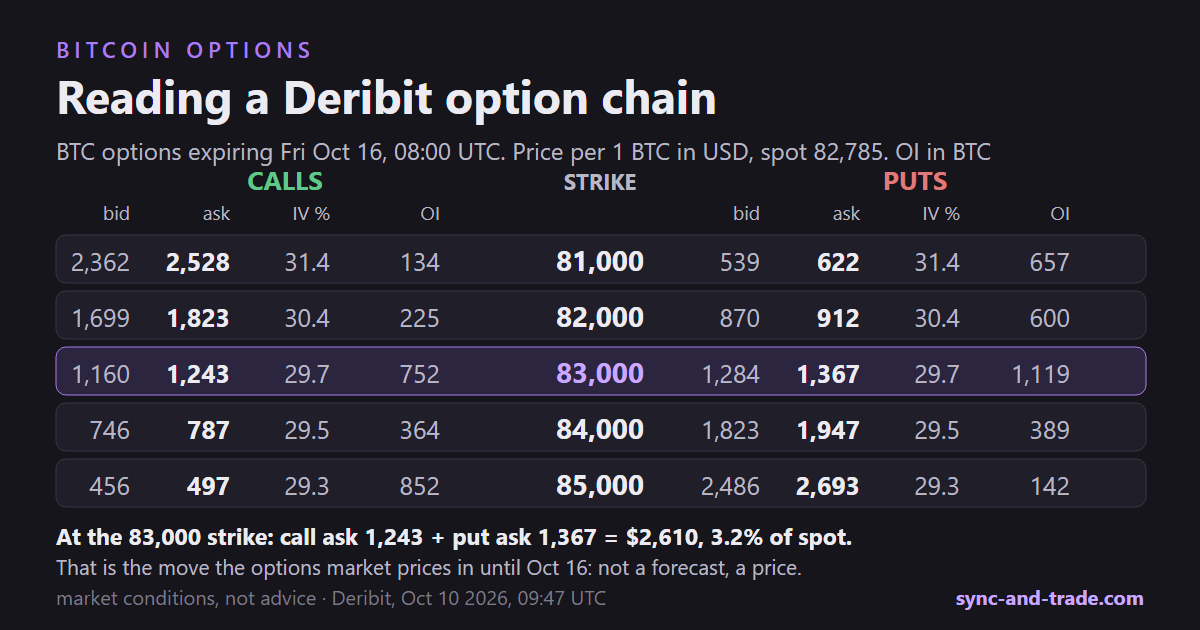
Here is one slice of it, taken on Saturday, October 10, 2026, with Bitcoin at 82,785.
What each row says
One row is one strike: the price at which an option can be used. The left half is calls (the right to buy), the right half is puts (the right to sell). Prices are per one bitcoin, in dollars; OI is counted in contracts (one contract is one BTC) and IV in percent.
- Bid is what buyers offer you right now if you want to sell. Ask is what sellers want if you want to buy. The gap between them is the spread, and it is part of your cost.
- IV is implied volatility: how much movement the price of that option assumes. For this expiry it sits near 30% a year. Higher means the market expects bigger swings.
- OI is open interest: how many contracts exist and have not been closed. It tells you where people have positions, not who is right.
Look at the 83,000 row, right next to the price. A call costs 1,243 dollars, a put costs 1,367. Move down to 85,000 and the call drops to 497 while the put jumps to 2,693. Same expiry, same day. Distance from the price is the biggest thing that moves an option's price.
The one number worth taking from a chain
Add the call and the put at the strike nearest to the price. This is called a straddle. At 83,000 it is 1,243 + 1,367 = 2,610 dollars at ask prices, or about 3% of the price (3.2% at ask, 3.0% at the mid-market mark; the ask includes the spread).
That is roughly the move the options market prices in between now and the Friday expiry on October 16. Not a forecast of direction, and not a promise: if Bitcoin moves less, sellers of those options keep the money, and if it moves more, buyers do. It is just the market's price for a week of uncertainty, and you can check it any time against the actual moves.
Expiries, the other axis
Everything above is one date. The chain has a dropdown of them, and they are not equal in weight. Deribit options expire at 08:00 UTC. On October 10, tomorrow's expiry holds 2% of all open contracts and next Friday's 4.8%, but the October 30 monthly holds 36.7% and December's quarterly 32.2%. Open interest is not spread evenly across the calendar; it piles up on a couple of dates. Why that matters for price levels is in Bitcoin Gamma Exposure.
What the chain does not tell you
It does not tell you who is long and who is short. A thousand puts at a strike have a buyer and a seller each. Whether the money is a hedge, a bet or a trade built from several legs is not visible in the table. It also says nothing about direction. A high OI strike is not a target.
What the chain does give you, if you look at all strikes together, is where market makers will have to hedge more as price approaches. That is the idea behind gamma exposure and the levels map, and it starts with exactly this table.
Quick answers
What is an options chain?
A table of all option contracts for one asset, listed by expiry and strike, with bid, ask, implied volatility and open interest.
What does IV mean on Deribit?
Implied volatility, the annualized move the option's price assumes. It is higher for options priced in anticipation of bigger swings.
How do I find the move the market expects?
Add the call and put at the nearest strike (the straddle) and divide by the price. On October 10 that was about 3% to October 16.
Where can I see this in a more visual form?
The live map at sync-and-trade.com/gex turns the same chain into strikes and levels, and the course explains how to read them.
Market conditions, not investment advice. Deribit data (ask prices), snapshot October 10, 2026, 09:47 UTC.